
Coupang news |
Coupang partners with Ulsan to achieve 100% nationwide Rocket Delivery
Coupang partners with Ulsan to achieve 100% nationwide Rocket Delivery. Click to learn more.

By Geo J Son & Sam HS Jeon
Coupang’s Rocket Delivery service is the most crucial and attractive feature to WOW the customers. This is achieved by the combined efforts of our delivery drivers, referred to as Coupang Friends (CPFs), and the optimized delivery system.
To enable CPFs to deliver the parcels in the most efficient way possible, the delivery system must have a correct understanding of the delivery address and then direct the drive to the best delivery area for the delivery address. Also, to evenly assign and distribute parcels to each area for optimization, experienced camp workers must be able to frequently update the area information.
Our existing system was dependent on text-based addresses and postal codes, meaning that the system was not as intuitive, functional, or utilitarian as we needed for our complex operations.
Therefore, we started a project in 2021 to provide the foundation for visualizing the delivery areas on the map, enabling direct modification to the map, and providing further metrics and statistics for optimization.
1. Challenge: Text-based postal code
3. Adopting H3 into delivery area management system
4. Geospatial indexing systems
6. Redesigning the system with new techniques
9. From a hexagon group to a hexagonized polygon
Postal codes are one of the most well-organized systems guaranteed by the government and authorities that assign a code to a specific delivery area. The physical areas of postal codes vary in terms of geometric element and delivery demands, but the efficiency of deliveries they provide is highly optimized. That is why Rocket Delivery adopted the use of postal codes in the beginning as the basic unit for assigning delivery areas. It worked for us at first, but the growth of Coupang demanded much more. The number of deliveries that needed to be made each day per postal code increased from double digits to triple digits. That was too much for a single CPF to cover in one day.
Therefore, we needed to segment a single postal code and break it down into multiple processable areas. For segmentation, for example, we started by perceiving the postal area as multiple apartment complexes. Then, we segmented that into a single complex, and then further into individual buildings. However, because addresses were solely in text with no or little spatial information, only experienced camp leaders and CPF group leaders were able to manage segmentation since they were familiar with the characteristics of the delivery areas.
To address our needs, we started an initiative. We used a hexagon grid-based spatial indexing system that provides an intuitive way to manage spatial areas by drawing polygons on a map.
Drawing polygons on a map might seem simple, but it is difficult to meticulously cover all areas by clear and definite boundaries without duplicating or omitting areas. To manage mutually exclusive and collectively exhaustive (MECE) polygon sets, we started by defining the spatial units.
We first reviewed various domain geospatial indexing systems created by GIS professionals. A geospatial indexing system is a set of grids which fully cover the specified geographic surface with unique identifiers. Postal codes and administrative divisions are good examples of irregular-shaped grids, and flexibly editable by authorities. For an analysis of integrated time series, mutable spatial boundaries, of which identifiers do not change for areas that they are assigned to, have more advantages.
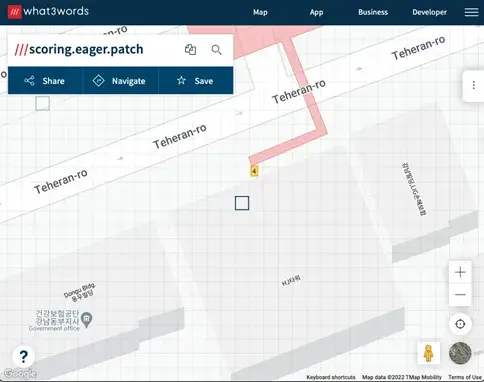
W3W (What3Words) is one of the most popular spatial indexing systems, which splits the world into 3-meter square grids and gives each grid a unique combination of three words. Latitude-longitude coordination system has difficulties in delivering on verbal messages as it is made up of a long sequence of numbers, while W3W can place the location with the combination of only unique 3 words. For example, Rocket Laboratory, one of the Coupang offices, is located at [37.503819, 127.0481493] in latitude-longitude coordinates and the W3W is [scoring.eager.patch]. Unfortunately, the size of the resolution cannot be adjusted for analysis.
Google’s S2 and Uber’s H3 are popular immutable spatial indexing systems with parent-child hierarchies. N number of child grids are mapped to a single parent grid by 1:N relation. Child grids can be accumulated into their parent, and in reverse, parent grid can be divided into child grids. The level of grid size varies and can be flexibly selected according to the purpose and scale. For our project, we adopted H3 for benefits in scalability and implementation.

Table 1. Comparison of S2 and H3 (Source: Uber blog)
How can we accurately express delivery areas in hexagon grids for Coupang, having in mind that we need to cover all areas of the delivery service? The size of the hexagon needs to be optimal as we cover the entire area within South Korea. If the size is too big, multiple buildings or addresses can be assigned to the same single hexagon. If the size is too small, a single building or address can be assigned to the different multiple hexagons.
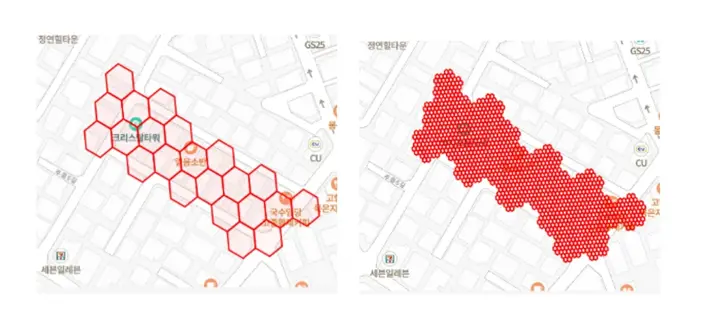
In Figure 2 below, the image on the left shows a 12-level hexagon example with a resolution of about 300-square meters. However, the size of the hexagon in the image cannot distinguish blocks which are divided by road and neighboring buildings. It is critical to segment a block into delivery areas and make it mutually exclusive to other blocks surrounding it. From this perspective, we adopted a 14-level hexagon with a resolution of 6.3-square meters. The resolution means that it can replace the latitude and longitude coordinates of precise locations like entrance and mailboxes.
Once we have defined the size of the hexagon for our service, we then needed to define how to manage data with scalability. South Korea can be divided into approximately 432 million hexagons in 12-level resolution. A parent hexagon has seven child hexagons, so a 13-level resolution would be converted to 3.1 billion hexagons and a 14-level resolution to 21.7 billion hexagons. We needed a way to manage data while ensuring sufficient scalability.
One way to manage data is to use RDBMS. We can use a hexagon ID as a key and put data into it. However, for general usage RDBMS restricts read/write function from 0.1 to 1 billion counts of table rows. If we manage the IDs row-by-row, we may be able to control the entire area of Korea in 12-level resolution, but it will be impossible to do so in 14-level without dividing the tables according to regions or adopting other standards. And even if we do somehow manage data by database sharing, we would not be able to avoid increasing the storage for data once we apply the service to more regions outside Korea. We concluded that it is not suitable for our use case to put specific data of which keys are individual hexagon IDs into RDBMS.
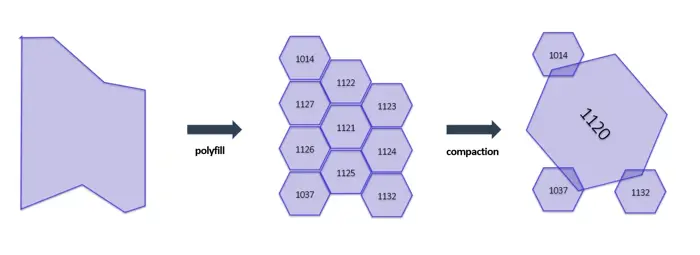
Therefore, we designed each delivery area to have information of hexagons. This means that a single large area can have a large number of 14-level hexagons, encountering potential memory or data size problems. To avoid this, we considered using the compaction functions provided by H3. It allows to convert between resolutions of child hexagons (finer) and their parent hexagon (coarser) when all child hexagons exist. We can also reduce the amount of memory for whole records.
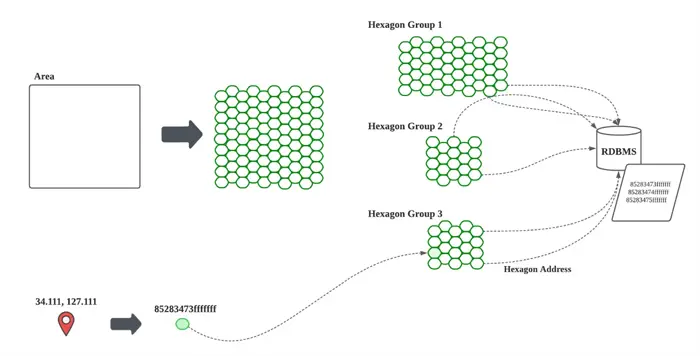
This design can store delivery areas efficiently and represents as many areas as required in the 14-level resolution. There are no regional restrictions or scalability issues. As shown in Figure 4 below, in order to search an area for a specific latitude-longitude coordinate as [34.111, 127.111], we simply convert the coordinate to an ID of a hexagon grid with 14-level resolution as 85283473fffffff and look up which hexagon group contains this hexagon ID. The inclusion relationship between hexagon ID and hexagon groups can be easily analyzed even in the environment that is not installed with PostGIS or other geodatabase modules.
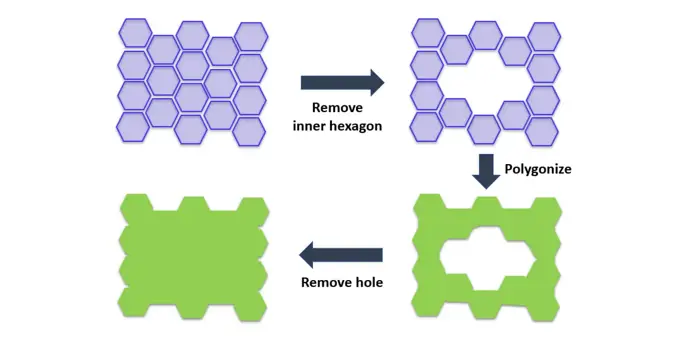
Once we completed the first phase of the system, we found some areas to be improved. For example, there were limitations with using hexagon ID lists. It was difficult to perform complex spatial analysis or find certain delivery areas that are distant from a specific point. To improve this, we kept the basic unit of the areas as hexagon grids but stored the actual data in a polygon format. Whatever polygon you draw, you can convert it to 14-level hexagon by the polyfill function and then store the boundaries back into polygon. This resembles drawing a pixel art. Convert a vectorized .ai file to a .jpg bitmap file, and segmentize it back into a vectorized image again.
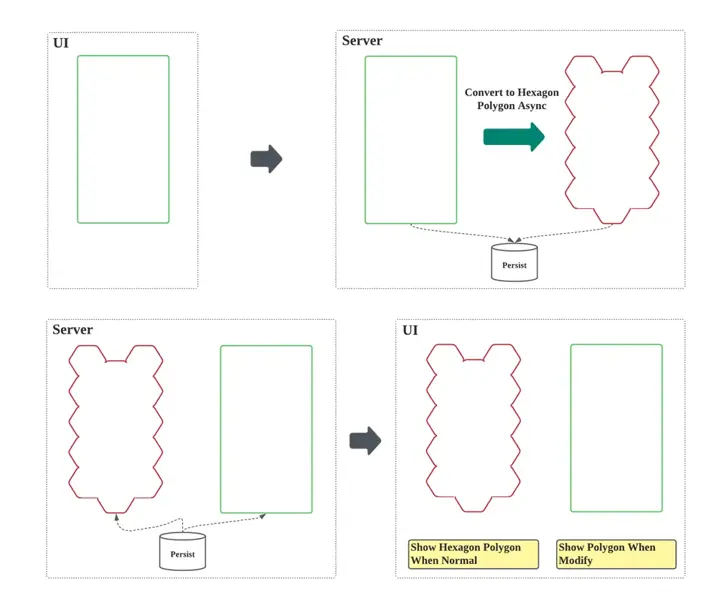
Hexagonized polygons also allow easy geosearching and managing delivery areas without overlapping or omitted areas. As shown in Figure 5 below, when a client draws a green square polygon on a map UI, the server converts it to a group of hexagons, and then generates only the outer boundary back into the polygon as a red hexagonized polygon. Therefore, a single area can be displayed with both user-drawn green polygon and the red hexagonized polygon.
The only one flaw of this method is, if the client side creates highly complex polygons, it may take a little longer to convert them into hexagons. We resolved to first store the polygon as drawn by users, and then later asynchronously generate and utilize the hexagonized polygon from it.
We have covered the concept of how users can generate and manage hexagon groups. This section introduces how to apply these techniques to the actual delivery area management system. As mentioned in the introduction, Rocket Delivery service considers the postal code as the basic unit of delivery areas, and subdivisions can be applied if necessary. Therefore, in the actual system, when the postal code is selected from the list, the spatial extent is displayed on the map.
As shown in Figure 6 below, users can freely draw polygons within the postal code area and add area description together in the actual system. When the Save button is pressed, the area data and polygon drawn by the user are transmitted to the server and converted into hexagonized polygons.
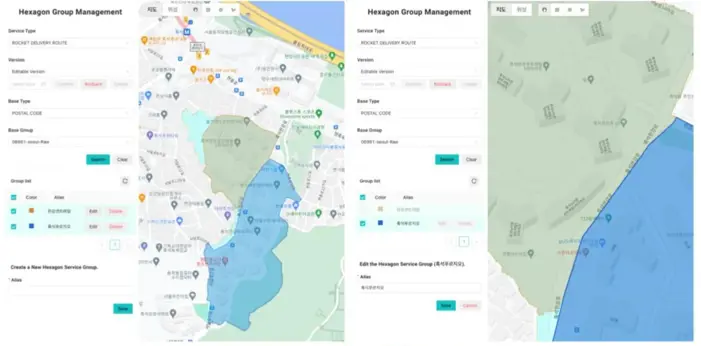
For example, the number 06961, a post code in Seoul, is selected and displayed on the map, which is then divided into two areas of hexagon groups. Both areas are individual apartment complexes located within this postal code. Each area is drawn with a drawing tool provided at the top of the map section, and the conversion to hexagonized polygon is automatically carried out. If you focus on the border of each area closely, you will see that the border is cut into hexagonal shapes and not a smooth straight line.
On the right side of Figure 6, the Edit button is pressed to make corrections to the area outlined in blue. The area outlined in yellow is still represented by hexagonized polygon, while the area outlined in blue is redrawn by smooth lines with user-drawn polygons. When the modification is completed, the modified polygon is processed by the server and updated to the new hexagonized polygon.
This post introduced how we designed our system to manage the delivery area efficiently by maintaining consistency with geodatabase. The new system is an improvement of our old system to provide better experiences for users, and it can still be used with the legacy system. Also, we have new further opportunities to improve the system as we utilize GIS-based spatial data as we have converted all textual addresses of delivery areas into spatial data.
The status and metrics of each delivery can be analyzed for each hexagon grid, which can produce spatially absolute statistics that are no longer bound to postal codes or addresses. Even if there is a change in the delivery area for some reason, the metrics can be compared on the same basis as before. Delivery areas can be accurately evaluated, and the less efficient delivery area can be identified quickly. This leads our team to be able to deep-dive the slowing factors and find the countermeasures to solve the problem.
Furthermore, we can analyze the conditions of delivery areas, from rating delivery difficulties, measuring distances to moving time between delivery areas and so on. These achievements lead to 1) evaluating the difficulty of the delivery area more precisely, 2) managing the delivery area dynamically according to the volume of the shipment, and 3) recommending the optimized trip routes for CPFs to deliver safer and faster.
Some were skeptical about our Rocket Delivery service when it was first released, as it seemed impossible to guarantee overnight delivery of goods. But now, it is a new standard of the Korean online shopping culture. Coupang will continue to develop the delivery system through technological innovation to continue to wow the customer.
We’re actively looking for new teammates who share our vision and will accomplish great things together. Interested? Check out our career website.
While the technical content in this article reflects our company’s research activities, it does not necessarily indicate our actual investment plans or product development directions. This content is purely for research purposes and should not be used as a basis for investment decisions. Please refer to our official announcements on ir.aboutcoupang.com for information on our formal investment plans and product development strategies.
Coupang news |
Coupang partners with Ulsan to achieve 100% nationwide Rocket Delivery. Click to learn more.

Engineering Blog |
In the last couple of years, Coupang has been using machine learning [ML/AI] heavily to improve customer experiences in areas like search, ads, catalog and recommendations. ML drives important decision making in pricing, transportation and logistics.

Engineering Blog |
In this post, we share how the finance and engineering teams at Coupang have partnered together to provide a roadmap to manage and optimize cloud expenditure. We will cover how multiple engineering teams formed a Central team to further optimize the cloud spending for on-demand cost.